🤷♂️How to use the mission
At first glance
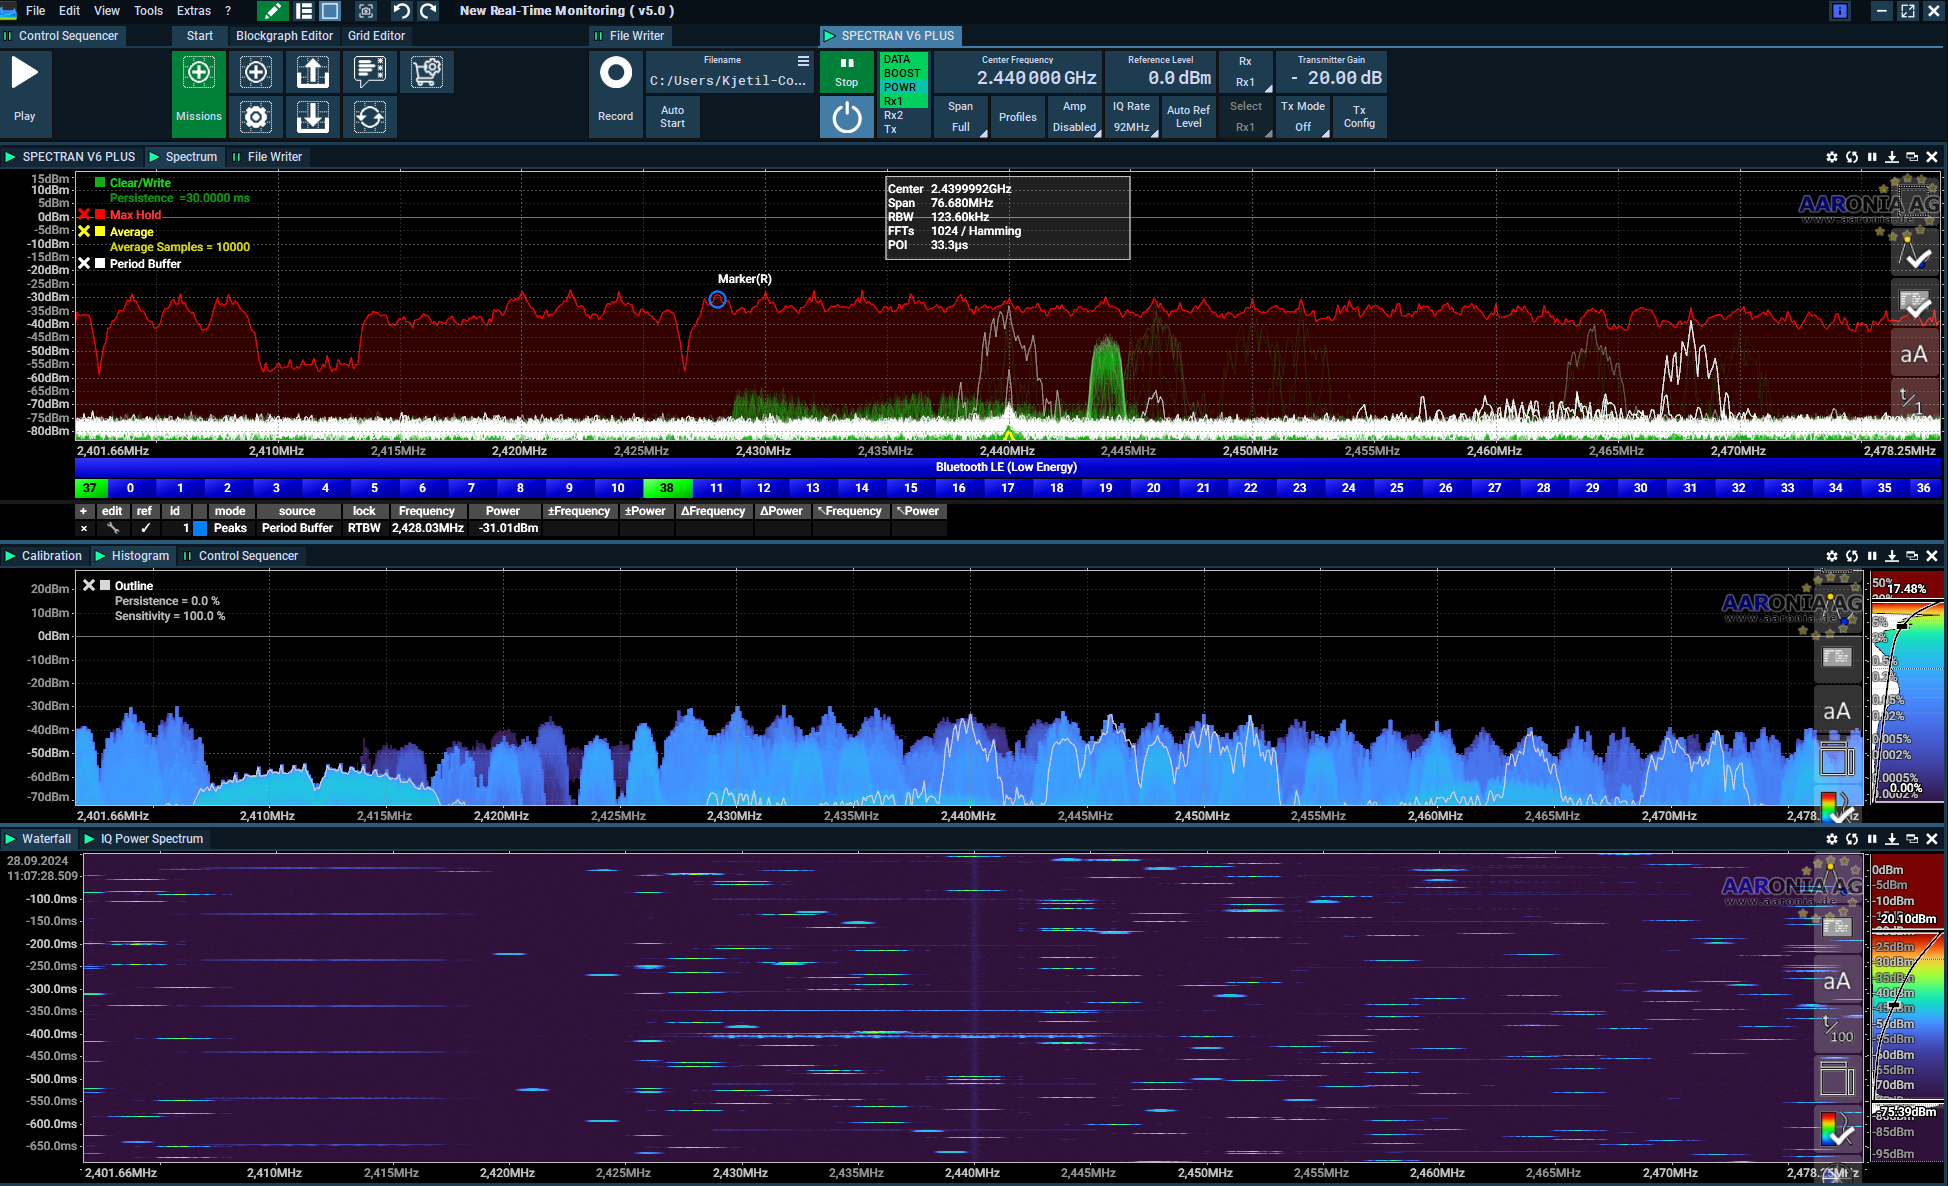
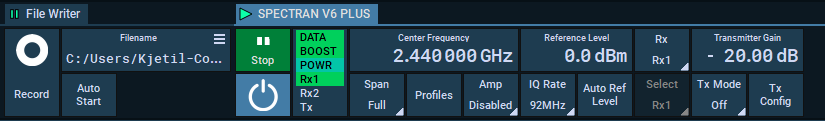
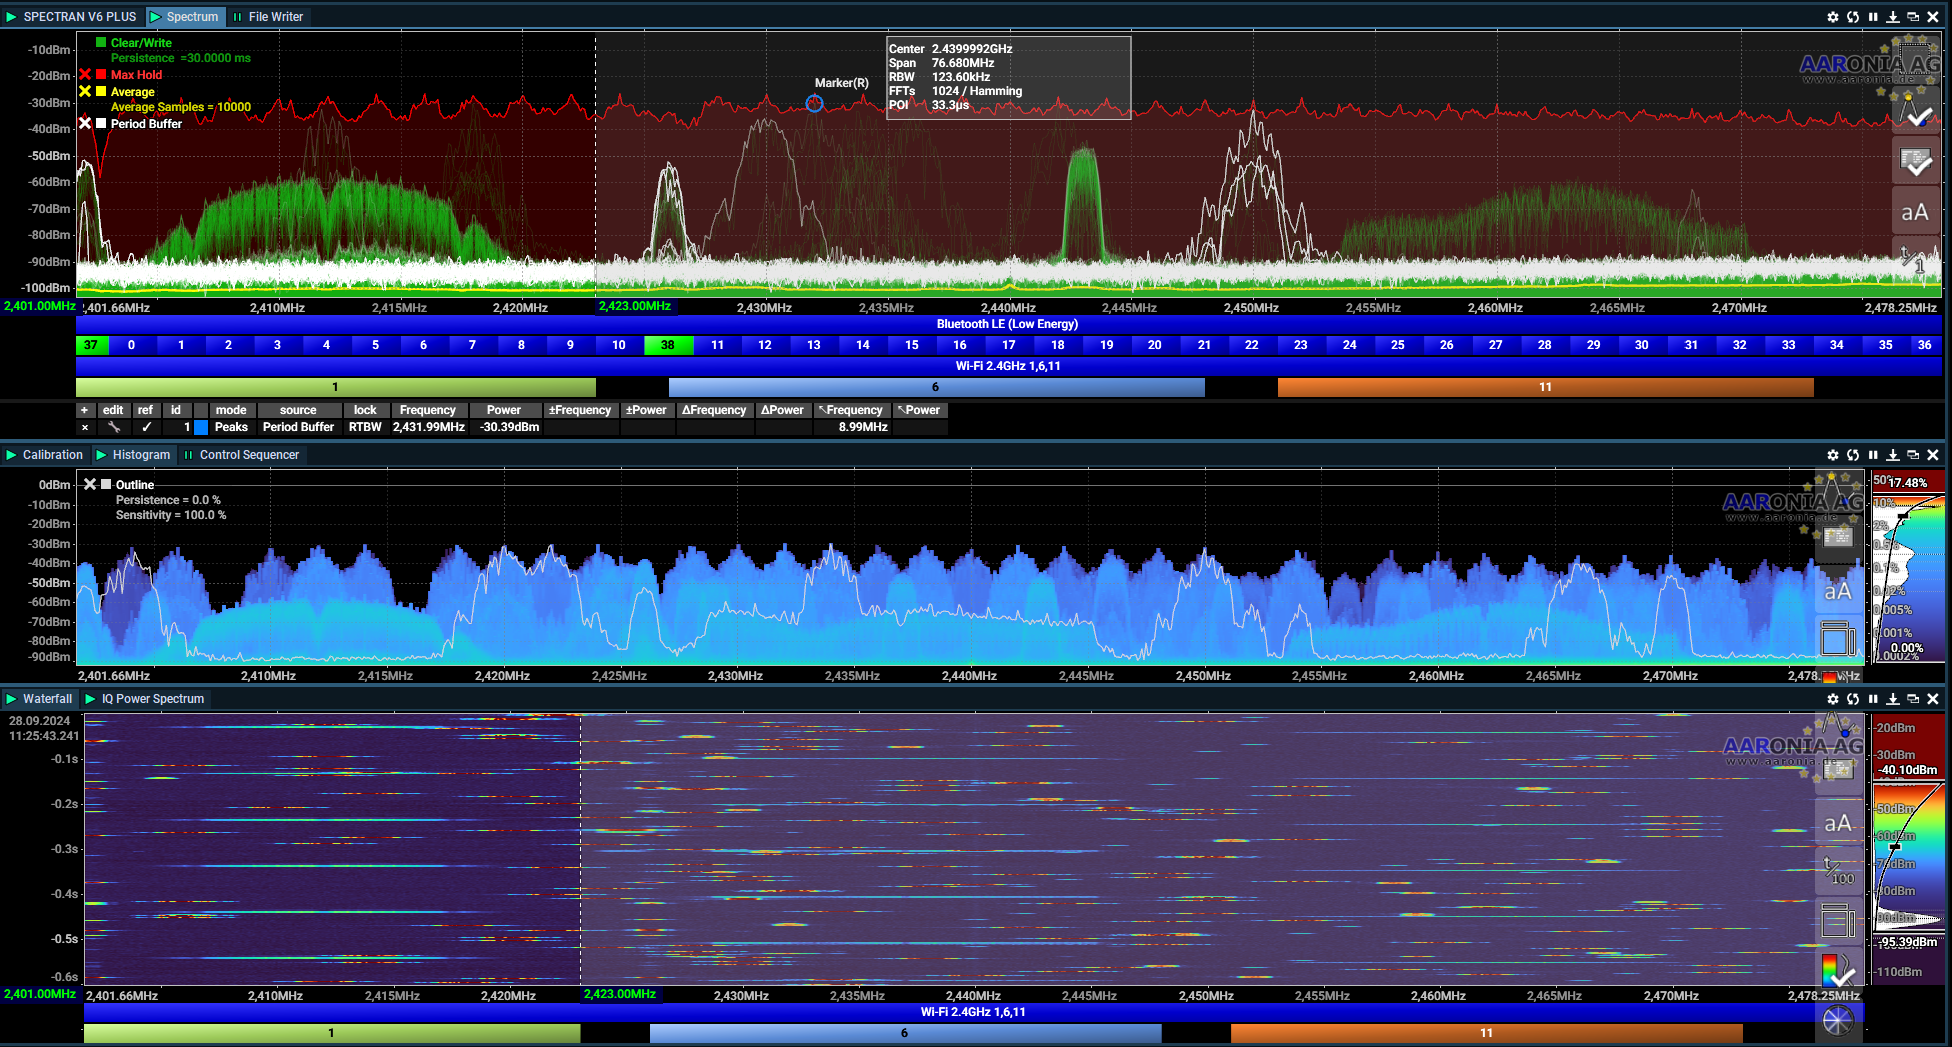
This is what you see when you open this mission, it will be set to a reference level at 0.0dBm and all amps should be disabled. This is a good start to protect the V6. The IQ rate is 92 MHz, that will end up to be approximately 80MHz and cover most of the 2.4 GHz band.
There will be a DC spike in the middle, this is not a real signal and is seen since works like a zero-if reciever where the sample is down-converted to zero-if hence the DC spike. Use Span ½ to remove it.
What to change first.
Reference level
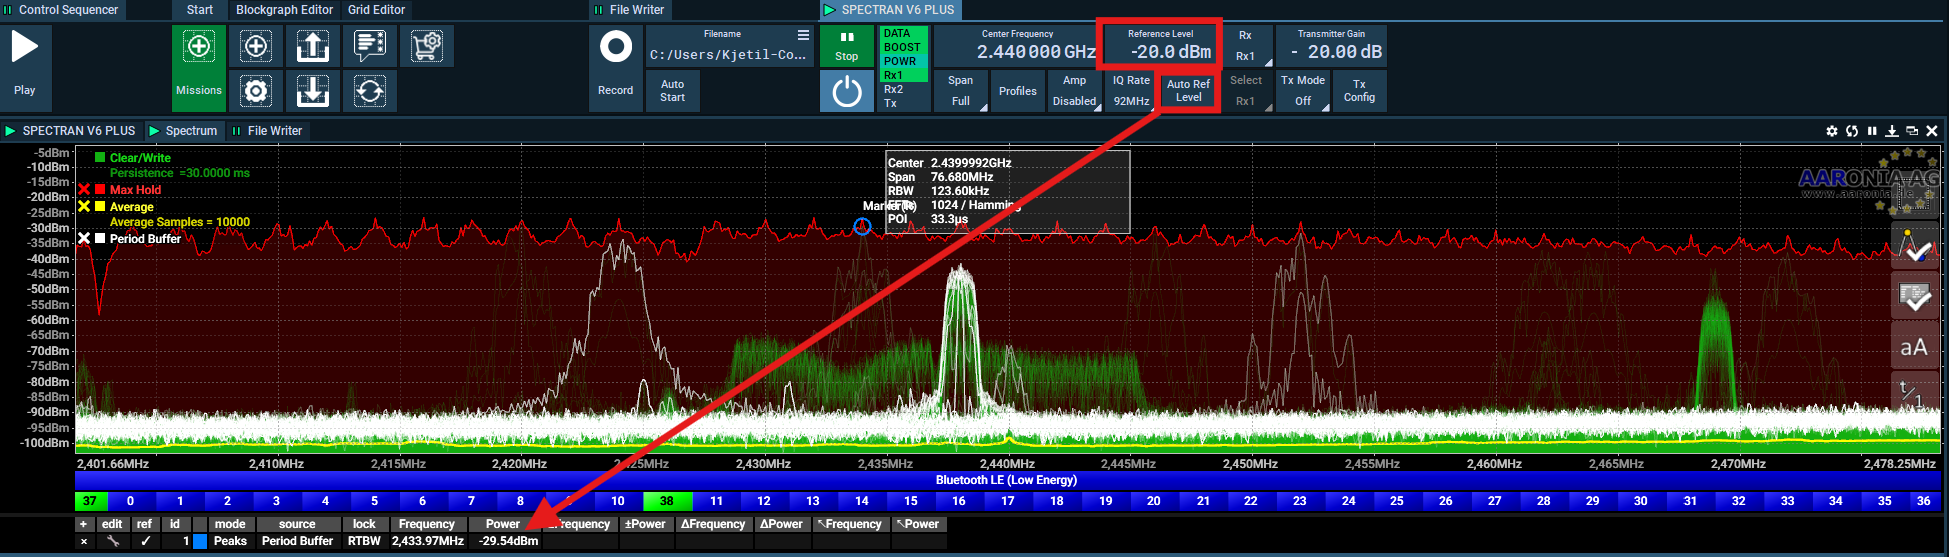
The reference level is at 0.0dBm and can be changed to -20dBm or lower if you use any amp, a good reference level should be above the highest highest expected signal strength. This can be quite high if you use a BT mouse or keyboard close to the antenna.
Auto Ref Level: If you push this, the software will automatically change the ref.level based on the received signals.
Add or change to a Wi-Fi 2.4GHz Profile
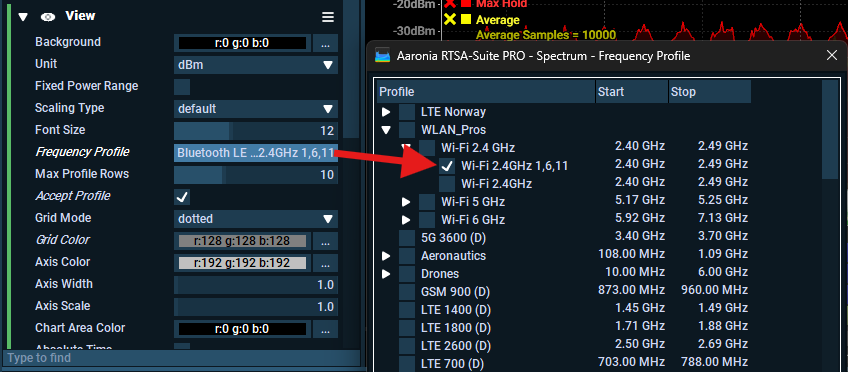
If you like to add 1,6,11 to below the spectrum you can do this in each block (waterfall, spectrum, histogram) by double tapping the mission name and open the profile section
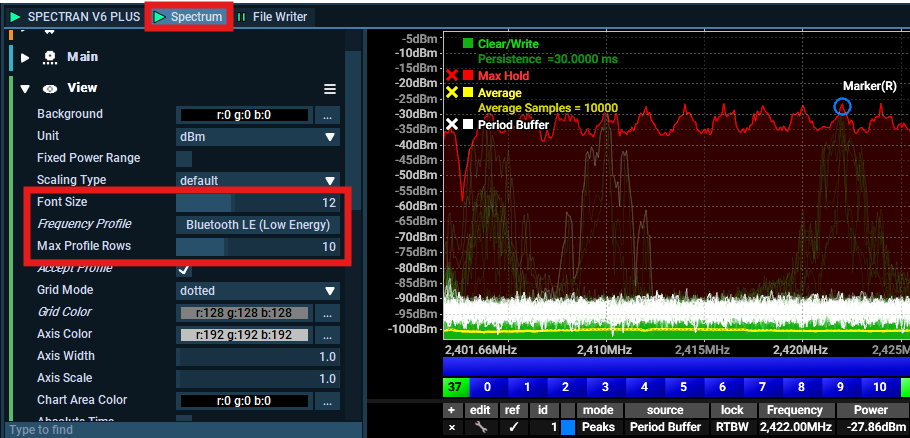
Select for example the 1,6,11 or use the profile with all channels, the last one takes up some space so I like to use the 1,6,11 profile.
Much better 🎉
Change the color palette of the waterfal
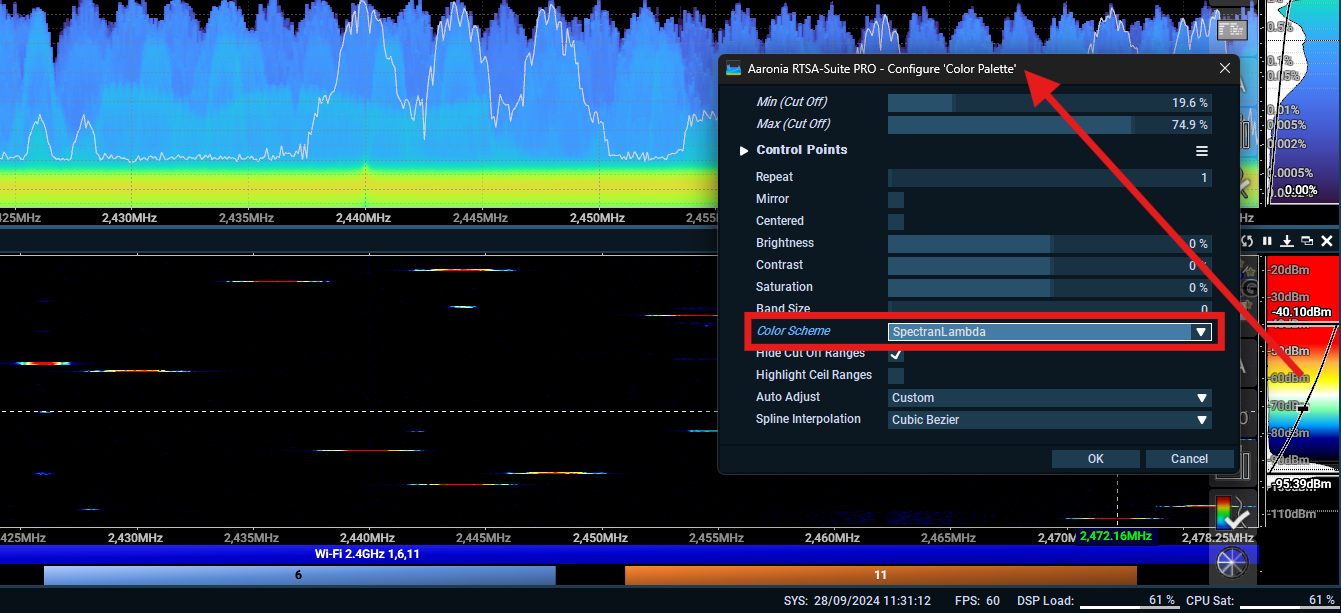
If you would like to use different colors in the waterfall, you can do this by right-clicking the color palette and selecting "Show Properties." In the example below, I changed it to Spectran Lambda.
Spectrum Traces
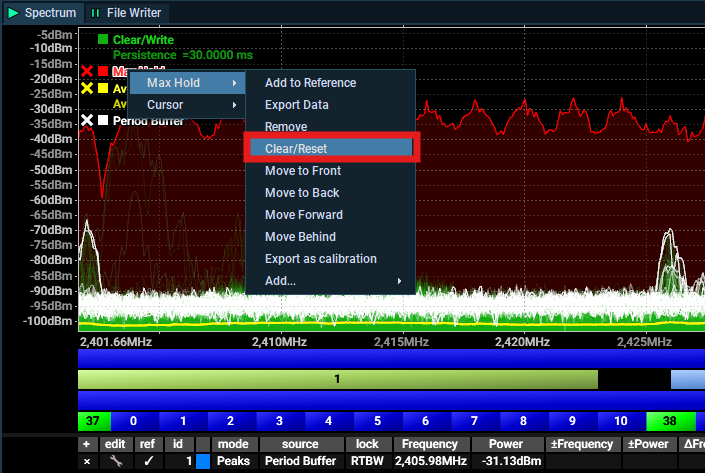
You can add, remove traces directly from the spectrum view, or add it in more details in the block-configuration move. Below I have selected the "Max Hold" and showing you how to clear/reset the max hold in the spectrum view.
You can also disable them here by pressing the square, or delete by selcting the cross.
By going into the Spectrum View you can look at how all the traces are configured for this mission, and add new traces, change the color of all traces, and how they behave.
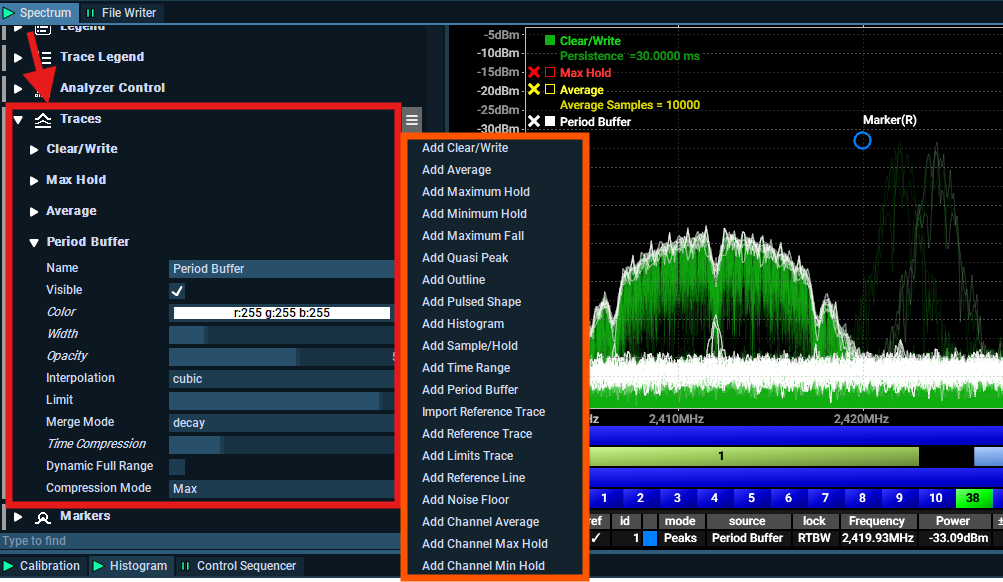
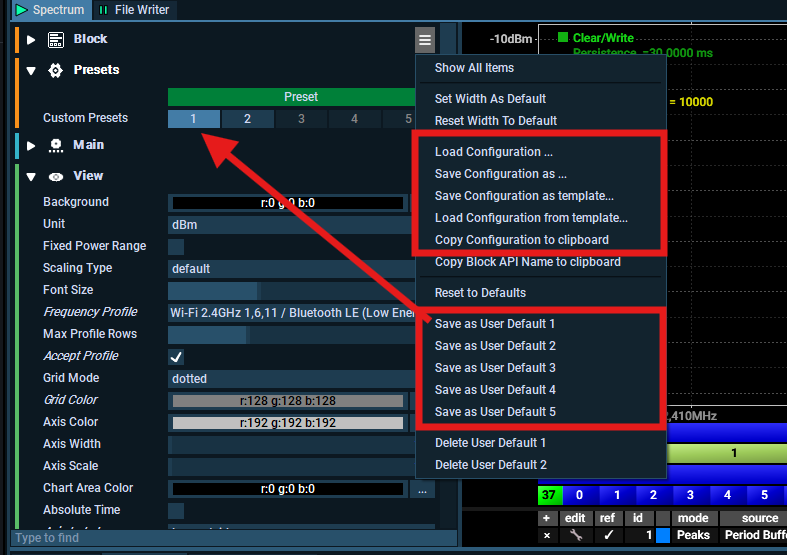
There are a lot of different ways to customize that it is impossible to cover everything, but a very good tip is that when you are happy with your view, you should save it as a template like this.
Here you see that I have saved this one as User Default 1 so I can select this preset whenever I use this block again for a different mission.
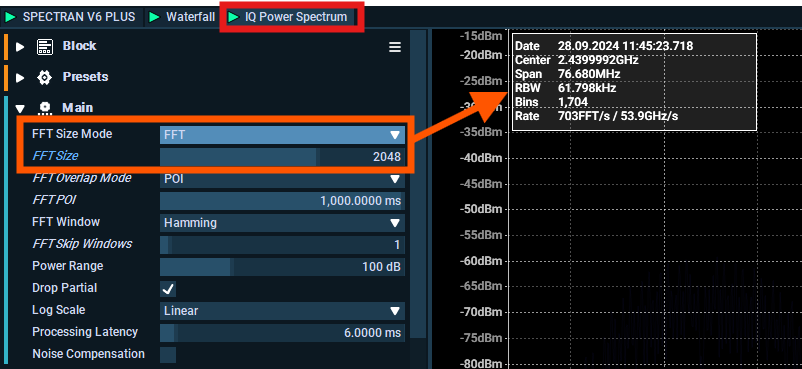
FFT, bins, RBW
This is real-time, so we are looking at 2.4GHz in real-time but to be able to view it we have to use the IQ to Spectra block that does the FFT calculations for us. The mission boots up with a FFT size of 2048 that ends up with 1704 bins for the 76.680 MHz span.
The FFT Size Mode can be adjusted using options such as FFT Size, RBW, and Bins. Changing one of these parameters will automatically adjust the others, providing a manual way to fine-tune the settings.
Higher FFT Size requires more CPU/RAM.
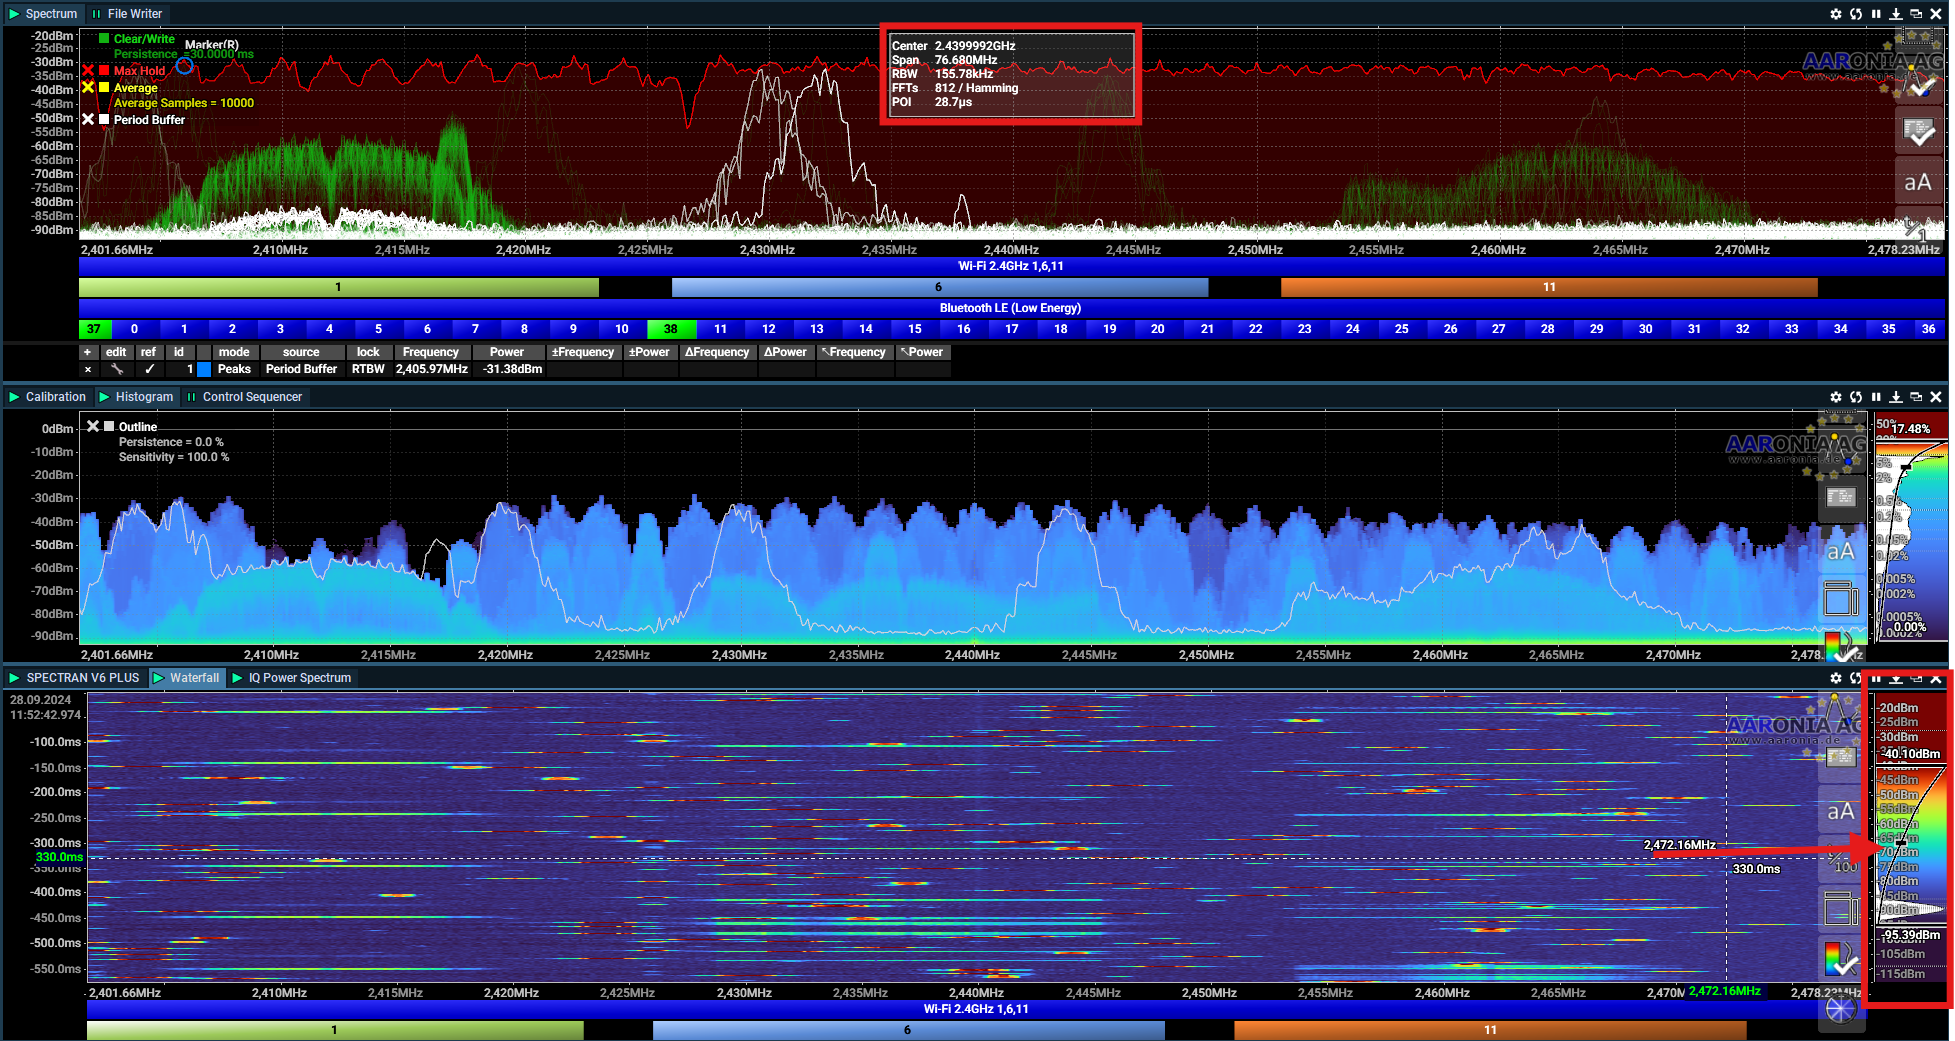
Example with 156kHz RBW
In the picture below I change the FFT Size mode to RBW, and changed it manually to 156 kHz RBW.
Noise floor will be different when you use a smaller RBW, so remember to change the colors to match your new settings by moving the slider. (arrow, below)
How do I record?
You have two options for recording data: you can either record IQ (which includes phase information) directly from the RF output on the V6 block or save it as Spectra. When you record Spectra, it will be captured using the FFT Size you have already set. However, if you choose to record IQ, you’ll obtain the RAW data, which can be analyzed on a more powerful machine later.
Keep in mind that IQ data takes up more storage space than Spectra for obvious reasons.
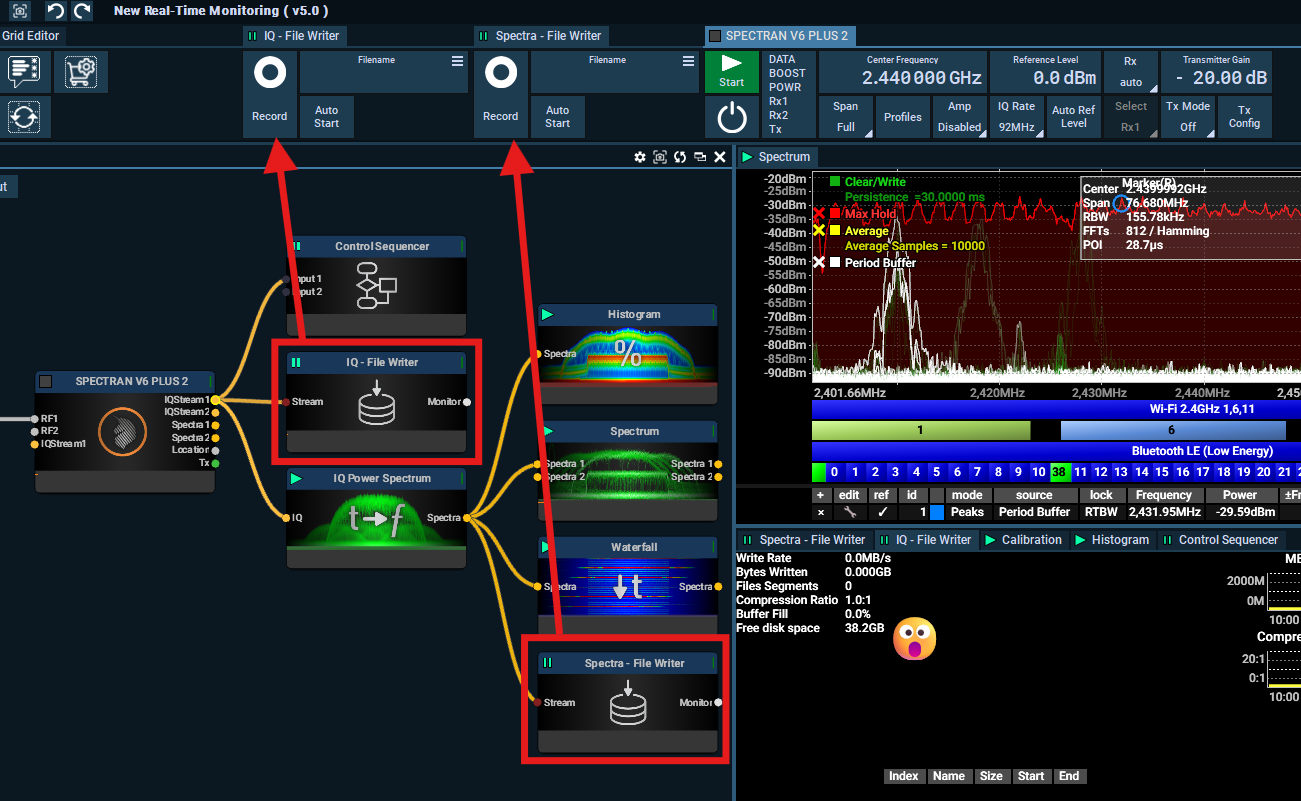
The mission includes File Writer block that you can connect to either the RF Input before FFT is calculated, or to the Spectra output after FFT. In the example below I added two blocks by just copy/paste the block that was already there, changed the name and connected it to the IQ-Stream output on the V6.
Then I also found out I had very little disk-space 😄
This is it for how to use, but what about looking at other frequencies? See the next page.
Last updated
Was this helpful?